Capital Asset Pricing Model – Cost of Debt Capital and cost of Preference Share Capital are easy to calculate as they depend on actual after-tax cash outflows on account of interest payment but calculation of cost of Equity Capital is little tough as it depends on market expected rate of return. There are many theories to calculate cost of Equity Capital. Out of all those theories Capital Asset Pricing Model (CAPM) is the most widely used method of calculating the Cost of Equity Capital. Under CAPM cost of Equity Capital is expressed as
Capital Asset Pricing Model (CAPM) is one of the widely used measures of calculating the expected stock return. Investors in National Stock Exchange (NSE)also use it extensively. This study aims to find the applicability of CAPM in NSE and to establish risk and return relationship for individual securities. In this paper it is also tried to find whether the individual securities are overvalued or undervalued using CAPM so as to help the investors to take their buy and sell decision.
Closing prices of top 10 different companies on the basis of their market capitalization from 2012 to 2016 have been considered. The basic model developed by William Sharpe (1964) and other authors in different times issued to serve the purpose. The research finds no applicability of CAPM in NSE as the difference between expectations and the actual results is very high at normal risk level.
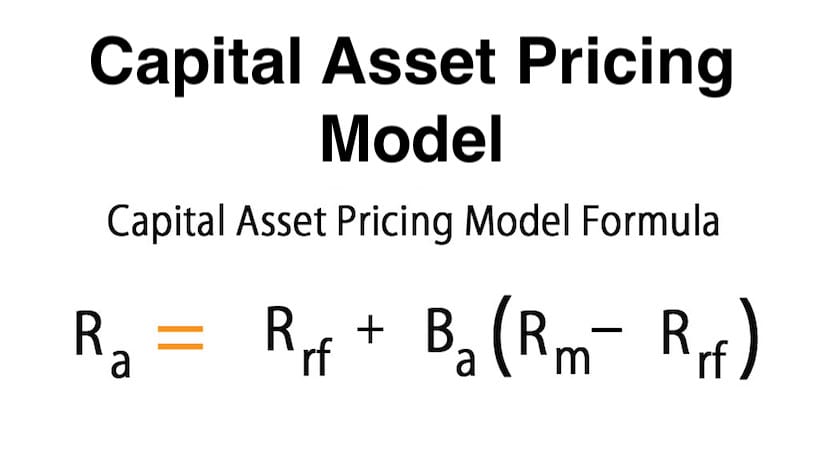
Capital Asset Pricing Model Formula
Risk Free Rate + Specific Risk Premium
Advertisement
or Risk Free Rate + Beta x Equity Risk Premium
or Risk Free Rate + Beta x (Market Rate – Risk Free Rate)
The risk free rate represents the most secure return that can be achieved. There is no consensus among the practitioners regarding risk free rate.
Specific Risk Premium is a multiple of Beta and Equity Risk Premium. Equity Risk Premium is almost same for all the listed companies in the stock market. Unless the volatility of share prices and share market indices of two companies are same, their Beta will be different.
According to CAPM model, there exist positive linear relation between risk and return.Higher the risk higher will be the return. For the riskier securities the investors prefer higher return. The risk varies from securities to securities. There are some securities which are considered as risk free assets such as government bonds, treasury bills etc.
In these securities the default risk is zero. Whereas in case of corporate bonds and shares there is risk of default so they are considered as risky investments. As the shares are more risky to bonds, investors expect high return for investing in shares.According to CAPM expected return is equal to the sum of risk free return and risk premium. Security Market Line (SML) is used to find how the individual securities should be priced in relation to their systematic risk.
It is the graphical representation of CAPM which shows the different level of systematic risk of various marketable securities plotted against expected return of entire market at a given point of time. X axis of the chart shows the Beta whereas the Y axis shows the expected return. This model helps to identify whether the securities are undervalued or overvalued. when a security is plotted on SML chart, if it appears above the SML, it is considered under valued because it shows that security offer greater return against its inherent risk .If the security appears below the SML , it is considered as overvalued as it does not overcome the inherent risk.
Recommended